Hey Quant X,
Over the weekend, markets were rocked.

Source: BBC News
Trump threatened 100% tariffs on Chinese exports.
China fired back with talk of retaliation.
In a single session — the S&P 500 fell 2.7 %, Nasdaq 3.6 %, and Dow –878 points (–1.9 %).
Just like that, trillions in market value evaporated, led by a tech sector bloodbath.
But what if this wasn’t just another headline — what if it’s a reminder of how fast fear can flood Wall Street?

Source: BBC News // Bloomberg
Because here’s the thing: this isn’t the first time markets have gone to war over trade.
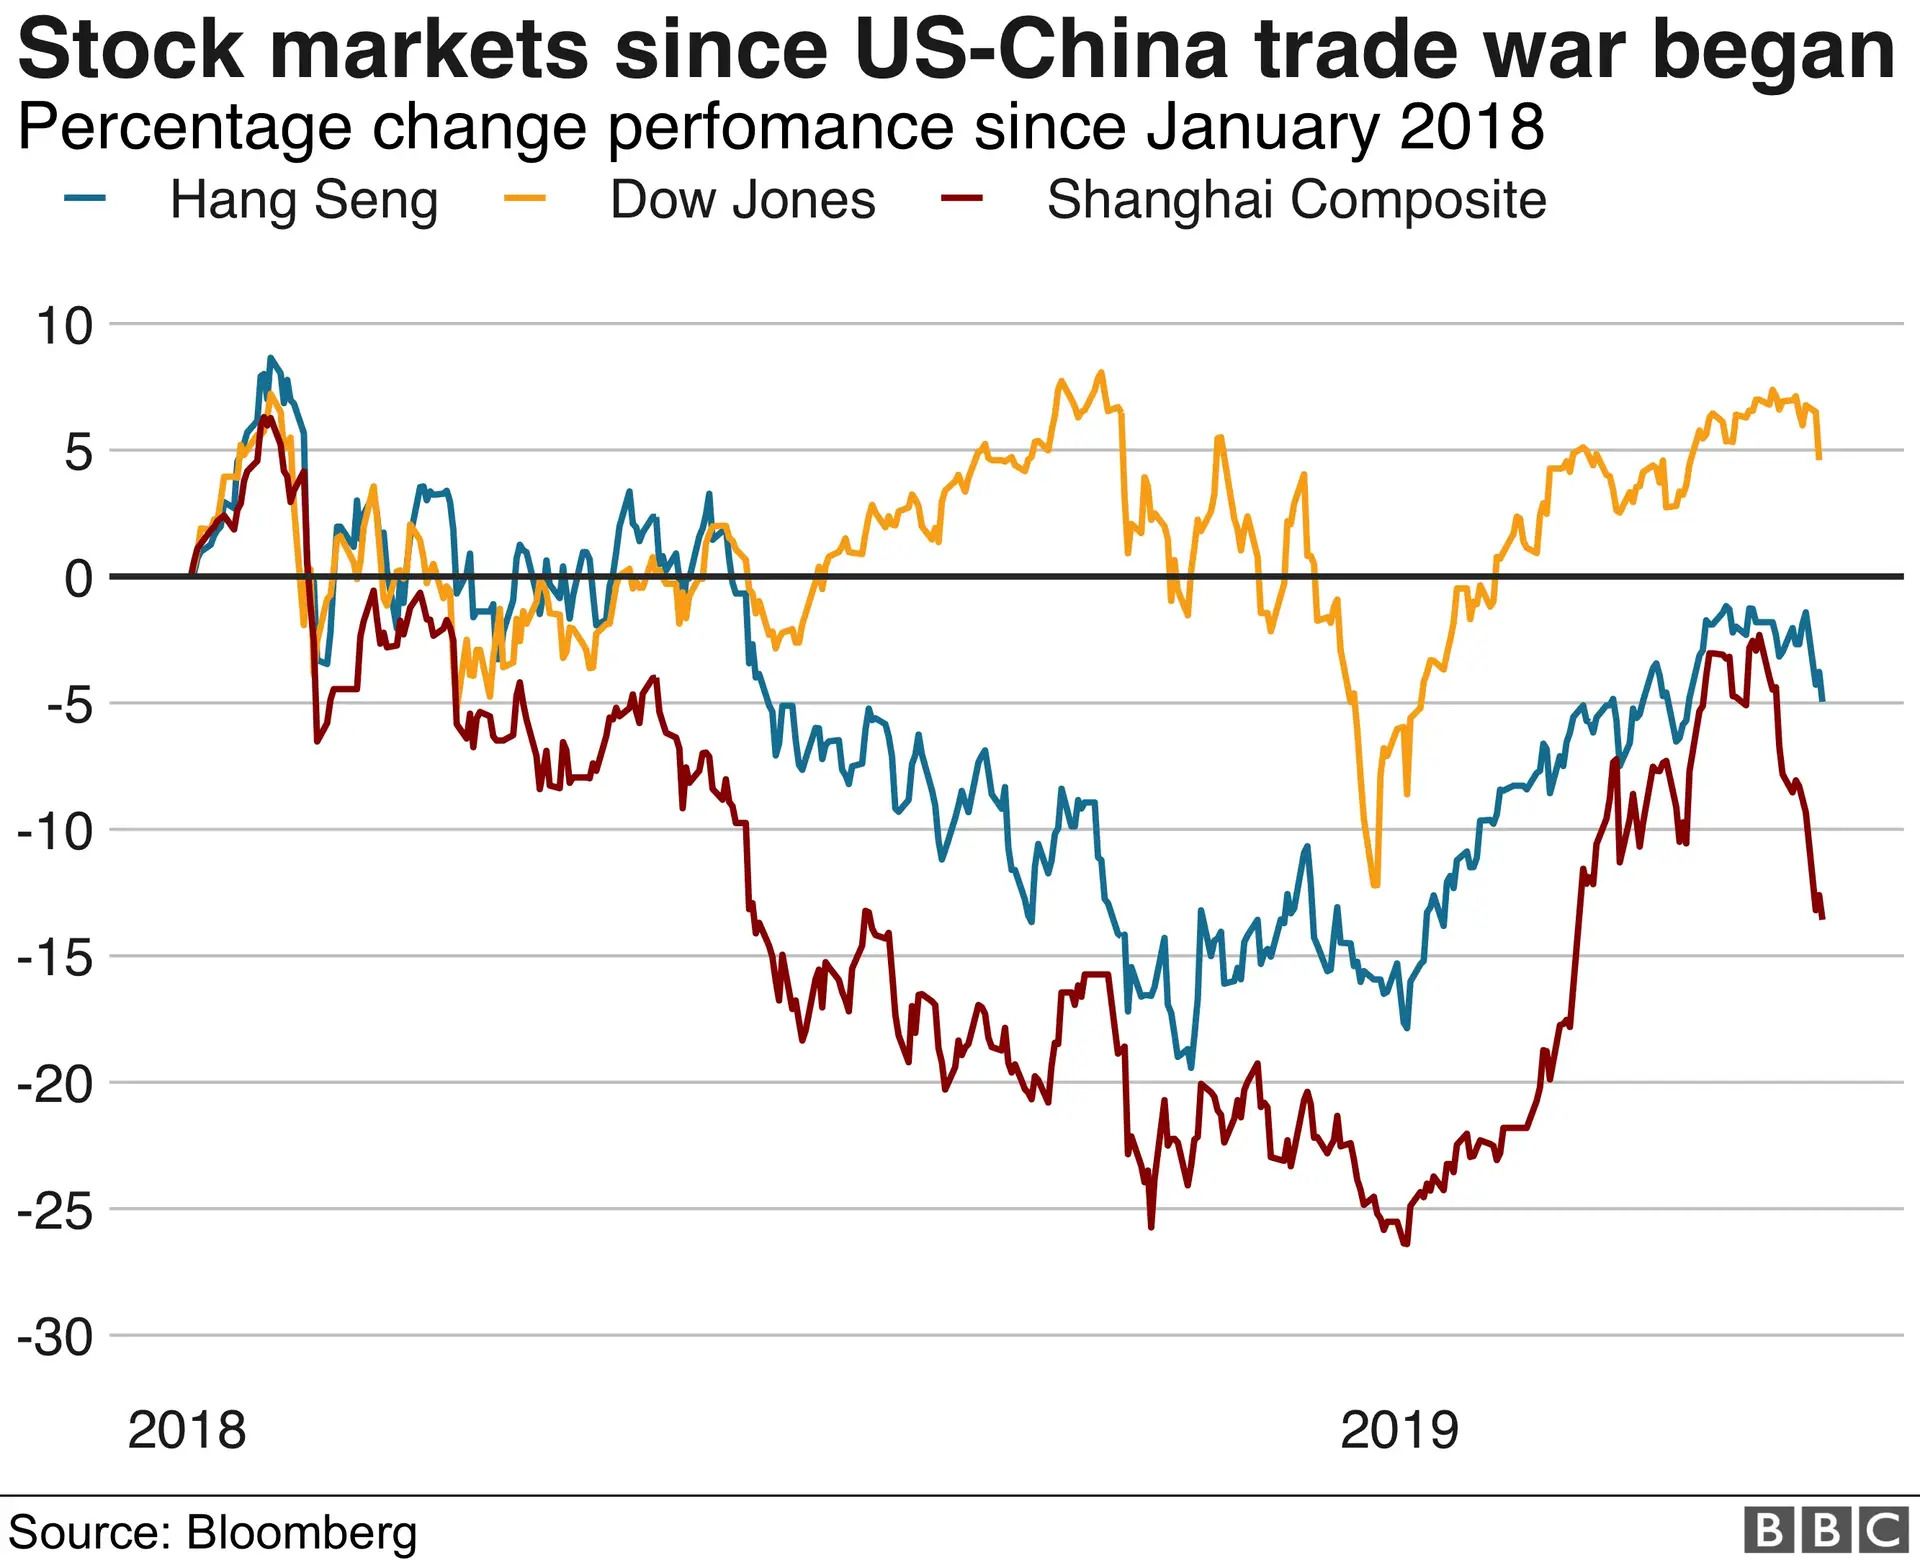
We’ve seen this movie before — 2018 to 2019, the first U.S.–China trade war.
Every threat, tweet, and tariff left data clues about how markets really respond to chaos.

Source: Bloomberg.com
💡 So what if we could backtest that fear?
To separate signal from noise.
To see when panic was justified and when it was just… panic.
That’s exactly what we did in this week’s video.
We dug into years of historical market data to answer three key questions:
1️⃣ What truly triggers a sell-off — tariffs or uncertainty?
2️⃣ How long did each panic take to rebound?
3️⃣ What signals warned investors before the crash?
And the answers might just change how you view market “crises.”
🎥 Watch the full breakdown now:
Trump’s Tariff Threat Just Erased $1 Trillion — But History Says Don’t Panic.
🔔 Subscribe to our channel for weekly data-driven breakdowns.
Or join our Quant X Community — where we read markets through math, not media.
Data is King.
Sizing is Everything.
Team Quant X
⚠️ Disclaimer: The content shared is for educational purposes only and reflects personal opinions. It should not be taken as financial or investment advice. Always do your own due diligence before making financial decisions. We do not PM anyone.


