Imagine the most powerful government on earth… just switching off.
The lights go out. The doors get locked. 750,000 workers sent home overnight.
Total political chaos, but here’s the twist:
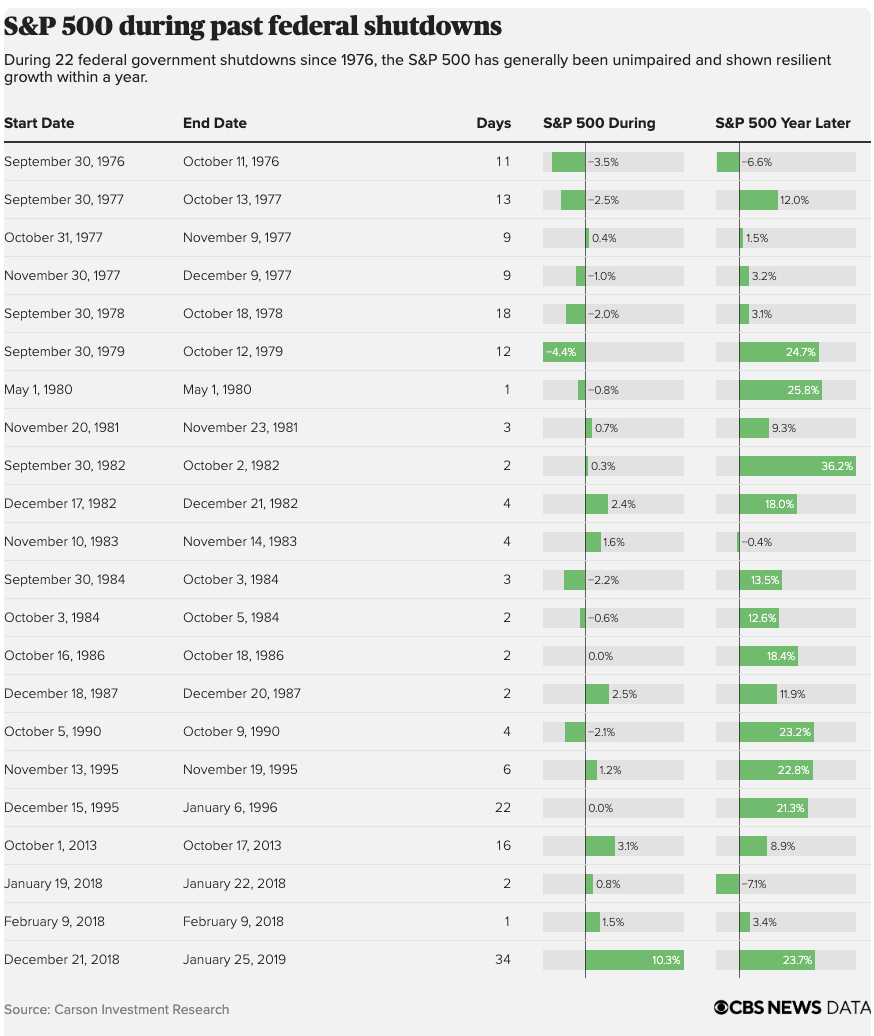
Wall Street barely moved because while Washington froze, the markets did what they always do — ran the data, not the drama.
Think of the U.S. government like a subscription service.
When politicians stop paying the hosting bill, the platform goes dark.
But investors? They don’t rage-quit. They look at user data — every past shutdown — and run the numbers.
Chaos feels new but to a quant, it’s just another pattern in the dataset.

💡 3 Data Takeaways from 21 Shutdowns
📊 1️⃣ Shutdowns ≠ Market Crashes.
After 1990: S&P +23%
After 1996: S&P +21%
After 2019’s record 35-day shutdown: +24% in the next 12 months.
💡 2️⃣ Volatility Spikes, Then Fades.
Liquidity drops short-term, but capital quietly rotates back within weeks.
🧮 3️⃣ History Repeats — Until It Doesn’t.
Quants track regime shifts — moments when the old rules break.
The question isn’t “Should I panic?” It’s “Has the data changed?”
That’s how quants turn noise into probability.
🎥 Watch the Full Breakdown

Click on the link to watch the full video 👉 Why the Market Rises After Every Government Shutdown (and Nobody Talks About It) We unpack how shutdowns ripple through volatility, liquidity, and sector flows and how quants turn chaos into code.
🔔 Subscribe to our channel for weekly data-driven breakdowns.
Or join our Quant X Community — where we read markets through math, not media.
Data is King.
Sizing is Everything.
Team Quant X
⚠️ Disclaimer: The content shared is for educational purposes only and reflects personal opinions. It should not be taken as financial or investment advice. Always do your own due diligence before making financial decisions. We do not PM anyone.


